Trending Topics

 Trending
ChatGPT in Excel: Take the pain out of spreadsheet work

Many of us will have dragged spreadsheets into ChatGPT and asked it to fix something, write a formula or analyse data contained in the workbook. However, you don’t need to drag your Excel sheets into the chat interface anymore – ChatGPT can appear in the spreadsheet app itself.
What’s more, the plugin is free and available globally. It’s also available for all the usual plans, including Enterprise. Enterprise end users will find that it’s disabled by default; admins must activate it for individuals or user groups.
Here, we reveal how to install the ChatGPT plugin for Excel and a selection of the things you can do with the AI assistant.
How to install ChatGPT for Excel
To have ChatGPT running inside of Excel (for either Windows or Mac) you first need to install this plugin from the ChatGPT website. You’ll notice there’s a similar plugin for Google Sheets, too, but here we’re focusing on Excel.
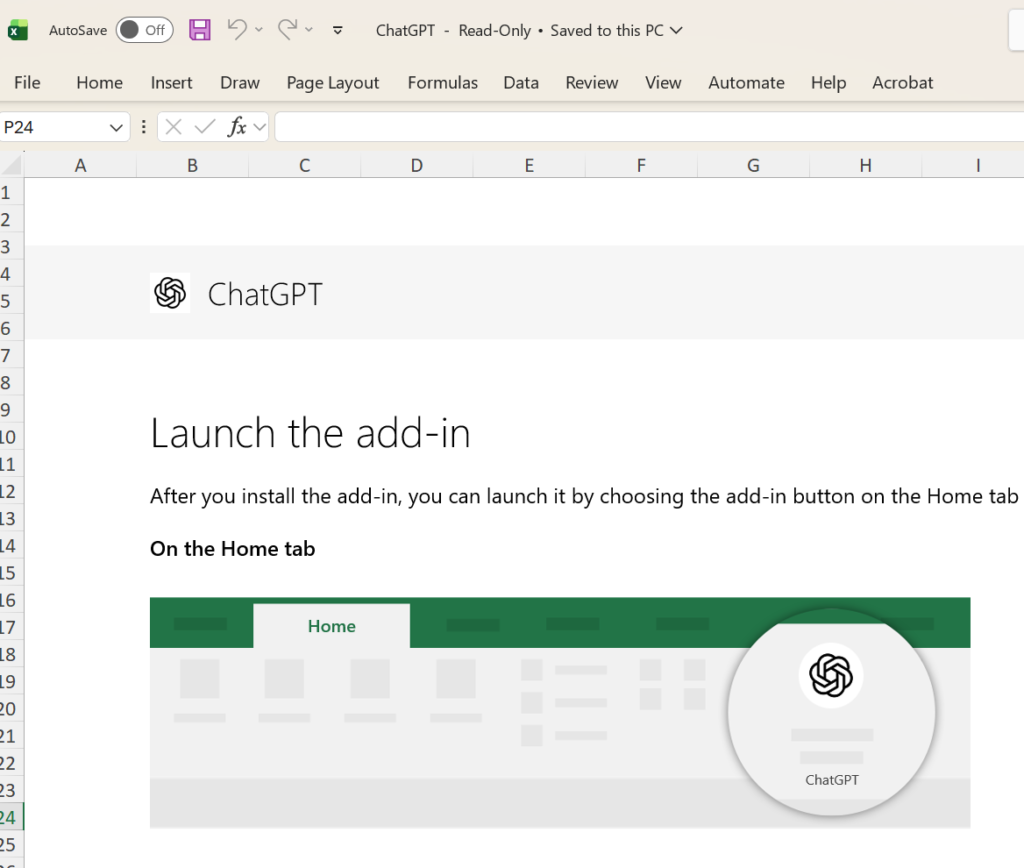
Once you’ve installed the plugin, fire up Excel and you should see a ChatGPT button appear in the Home tab. Click that and a sidebar will open on the right-hand side of the interface. You will need to log in with your ChatGPT credentials the first time you use it.
Create dashboards the easy way
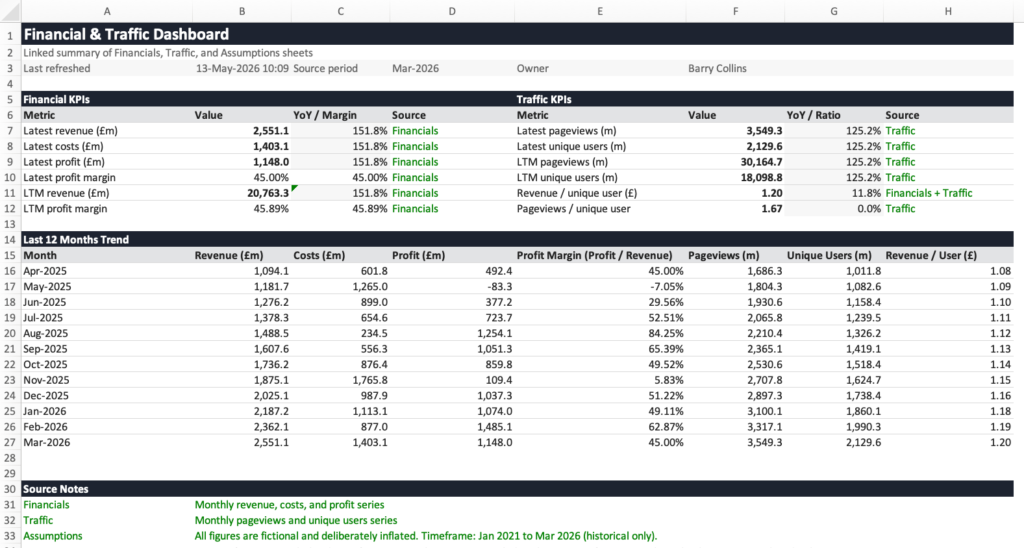
Let’s say you’ve got an Excel workbook full of the company’s financial data, containing various sheets. You want a dashboard that gives you all the key information at a glance, so you don’t have to wade through different sheets to find the key figures. ChatGPT can do that in a fraction of the time it would take to do by hand.
We open an Excel workbook containing lots of (fictional) data about TechFinitive’s financial performance, including monthly costs, revenue and profits, as well as website traffic figures.
Using the ChatGPT prompt bar that’s open on the right-hand side of the sheet we entered the following:
Can you create a dashboard of the key financial information from the three sheets in a separate sheet?
Within a couple of minutes, the AI has created a Financial & Traffic dashboard showing key stats such as the latest financial KPIs, traffic KPIs and data from the past 12 months. It’s also included graphs, so we can see financial and website traffic performance over the past year.
It’s calculated useful metrics by itself, which weren’t already in the other sheets, such as profit margins, last 12 months (LTM) revenue and profits, and revenue per user. All key information that TechFinitive executives would want to pore over!
Crucially, the data dashboard is generated dynamically: the AI hasn’t just worked the figures out itself and slapped them into a separate sheet, it’s created formulae behind them. So if the figures change or when the sheets are updated with the latest figures, the dashboard will update itself accordingly.
Clean up messy spreadsheets
A lot of the data captured in spreadsheets isn’t exactly pristine.
It’s common for spreadsheets containing customer or transaction data to contain duplicates, for example, especially if the data has been pulled in from different sources (an old and new subscription system, for example). ChatGPT can help you clear up the mess.
We took a spreadsheet containing more than 600 records of subscribers to a website, which included 25 duplicate entries. We then entered the following prompt into ChatGPT:
This spreadsheet contains our website subscriber data. It’s a merge of two different data sets and I believe there are some duplicate entries in this database. What’s the best way to review and remove the duplicate entries?
Note, we’re not asking ChatGPT to deduplicate the data directly, as that creates issues of trust: how could you be sure the AI wasn’t mistakenly deleting unique customer records, for example? We wanted it to show us how to deduplicate the data.
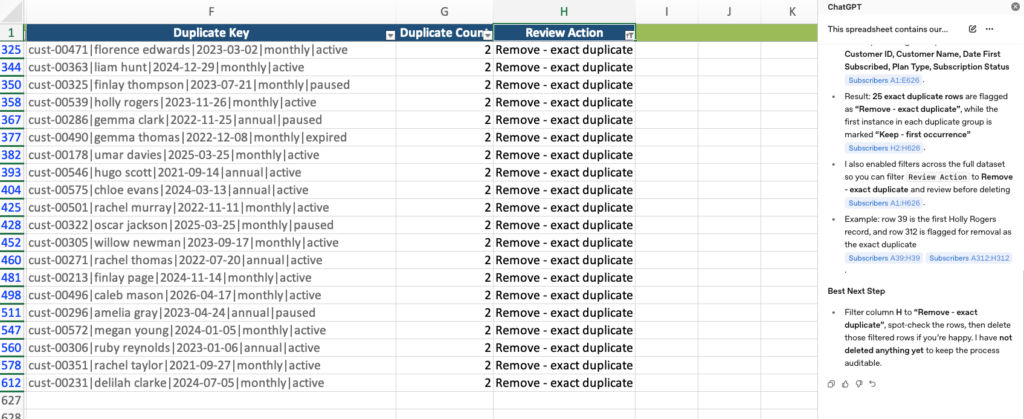
To help us clean the data, ChatGPT created three “helper” columns in our spreadsheet:
- 1. A duplicate key showing the customer’s name, reference number and other details
- 2. A duplicate count, showing how many times each entry appeared in the database
- 3. A review action, in which there were three choices: Keep first occurrence, remove duplicate or unique
A scan down the spreadsheet allowed us to easily see which names were marked as duplicates, and we could quickly cross reference if they did indeed appear earlier in the table, as those entries were marked as “keep first occurrence”.
ChatGPT also confirmed it had found 25 duplicates in its response and then told us how to remove the duplicate entries, by filtering the “review action” column to only show the “remove duplicate” entries and deleting them.
Going through this process and checking each entry in a much larger database could be slow going. But if you followed the same procedure and only checked, say, the first 10% of duplicate entries manually, you could at least have some confidence that the AI had correctly identified the dupes.
Once we’d deleted the dupes from our spreadsheet, we were also able to enlist the AI’s help in cleaning up what was left behind:
I’ve now cleared the duplicates. Can you erase the helper columns and remove any blank rows in the subscribers list?
ChatGPT completed the clean-up in a few seconds and the whole job was done in a matter of minutes.
Create pivot tables with ChatGPT (and why you need to be careful)
The following is a lesson in how things can go wrong by relying on AI and why you need to carefully check everything the AI does.
We have a spreadsheet containing sales data from an online retailer. The sheet lists individual products with their SKU, category, subcategory, unit cost, retail/cost price and other information, as shown below.
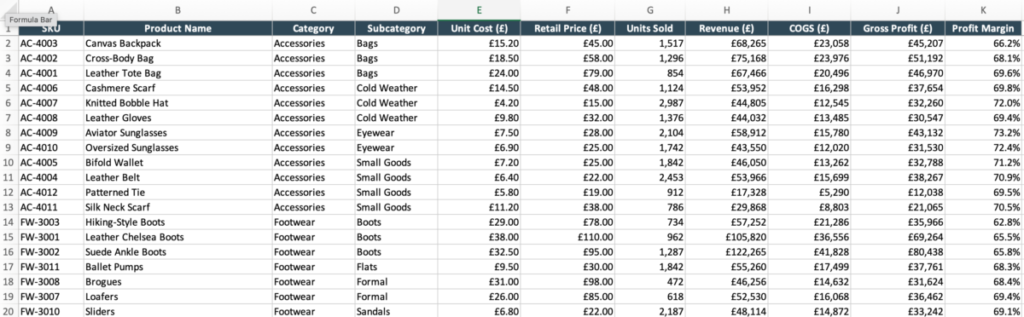
We want to know which of our product categories (accessories, footwear etc) has the best average profit margin, so we ask ChatGPT:
Can you create a pivot table that shows the average profit margin of each category?
The AI does create the table, but things are off. First, although it appears as a pivot table, the data in it isn’t linked. The values seem to have been pasted in by the AI. That sets alarm bells ringing. We then do our own maths on the figures to check ChatGPT’s working and they are slightly off. What’s going on here?
We ask ChatGPT:
How are these figures calculated? How are you arriving at the average profit margin for the category?
It explains that it’s basically taken each product’s individual profit margin and averaged those within each category. As the AI explains: “This is an unweighted average of product margins, not total gross profit divided by total revenue for the category.”
That’s why the figures were slightly off. It’s using an unweighted average (which could be badly skewed by a single, low-selling product having a very poor profit margin, say) instead of the weighted average we were really hoping for.
In fairness, this is partly our fault: we didn’t specify how we wanted the average profit margin to be calculated and the AI took the road of least resistance. The lesson here is to be as specific as possible with your prompts.
We ask it to calculate a proper weighted average, and this time it does the job properly, although explains that: “There are no remaining pivot tables on the output sheet; the values are live formulas that update when Product Sales changes.” Which is probably a good thing.
Analyse data with the ChatGPT for Excel plugin
Now we know the averages, it’s time to drill into the detail…
Create a table of our ten highest margin products and their individual contribution to overall gross profit
ChatGPT does this perfectly, popping the table on the same sheet as the table showing the average profit margin for each category:
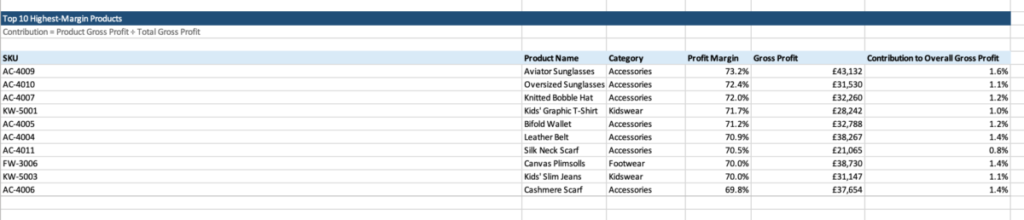
But now there’s another problem. When we look back up at the table of average profit margins, each of our categories is showing a revenue-weighted margin of “£1”, whereas previously it was showing the correct individual percentages. What’s happened here? We ask ChatGPT:
Why have the revenue-weighted margin figures all changed to £1?
ChatGPT spots its error: when it put the highest margin products table in beneath the average profit margin table, it mistakenly formatted the whole column as a currency. Percentages in the same column, which are expressed as decimals in Excel, were all being rounded-up to 1 and had a pound sign plopped in front of them.
It corrected the formatting error, but it’s a salient lesson. If you’re going to use ChatGPT on your spreadsheet data, check everything it does thoroughly. It can save you hours of time, but it can make errors that could cost you a lot more than time if left unchecked.
About The Author

Barry Collins
NEXT UP