Trending Topics

 Trending
How the Open Repair Alliance’s data reveals which is the most repairable laptop, phone and printer

What if you could find which technology brands won’t cost your business unnecessary outlay or downtime? Damage to your technology assets is inevitable. How valuable would it be to know which laptop brand is more repairable than its competitors? Which mobile offers a fast fix for your team, rather than unrepairable landfill?
The source data which generates this critical information is not based on survey or opinion, nor is it anecdotal courtesy of a loose-lipped OEM sales manager. It is real-world data logged from 32 countries globally and it’s available for you to use for free.
Neil Mather is the tech lead for The Restart Project and technical coordinator for the Open Repair Alliance. This organisation is responsible for collecting and analysing repair data from around the world. He was kind enough to tell TechFinitive about the immense value of repair data.
What is the Open Repair Alliance?
“The Open Repair Alliance (ORA) is a coming together of different repair networks around the world,” Neil explained. “We support thousands of repair cafés and Fix-It clinics. So we’re pooling together repair data that’s been collected on the ground, by people repairing things in community repair groups around the world.”
The ORA’s dataset goes back to 2012 and currently has over 300,000 records. This may not sound like a lot, but back in 2012, the Right To Repair movement was in its infancy. Today it has the wind in its sails and Neil has seen the movement’s maturing growth in the ORA’s data. “It’s huge, and it’s increasing year on year. Last year the data set had 208,491 records, so it’s increased by 46% in just one year.”
Inside the ORA’s data: which printer brand is the most repairable?
Inside the ORA’s data are repair records for thousands of printers. Isolating the (arguable) four market leaders — Brother, Canon, Epson and HP, the data reveals 4010 devices which have been brought to repair events.
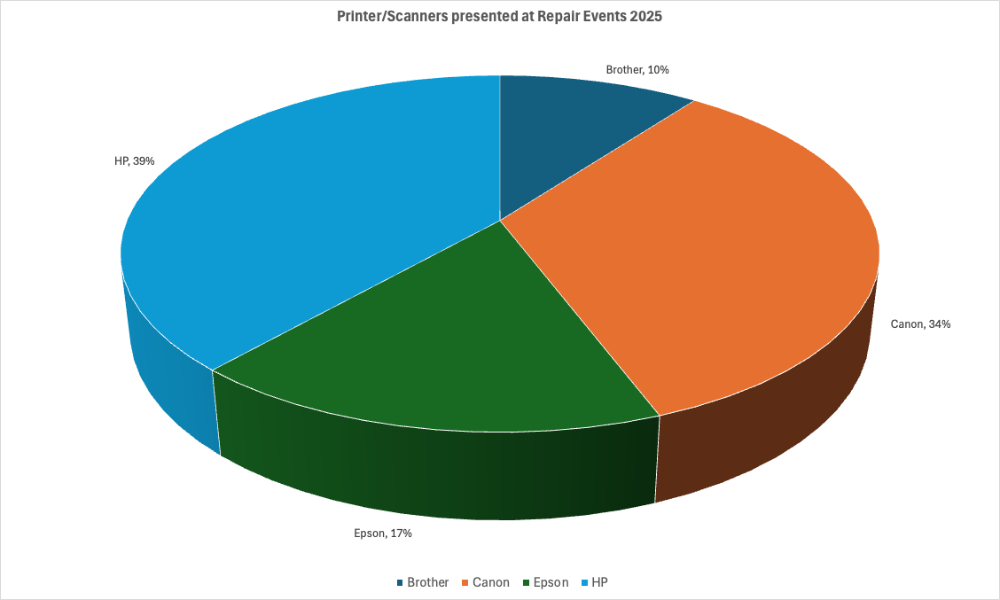
39% of the faulty printers in this isolated data set are by HP, closely followed by Canon (34%). Their position at the top of the leaderboard could be due to purely the volume of devices sold. Therefore, we can’t infer reliability from this data. What’s interesting is that Epson is a distant third, lagging behind HP by over 20%. Is this a gap in market share or are Epson printers far more repairable?
The answer is more nuanced than that.
Analysing the Open Repair Alliance’s Data
As always, data needs to be interpreted carefully. Much of the information in the data refers to very old devices – date of manufacturer and product age are both fields – so any analysis contains a heavy historical bias which does not necessarily represent products on sale today. The ORA certainly does not collect this data to bash a brand, but to strengthen their advocacy work to demand better repair and reuse legislation.
Despite its historical focus, the Open Repair Alliance’s longitudinal data remains valuable for tracking how brand repairability, within community repair groups, has changed over time.

Irrespective of how many more printers HP shifts than Epson, the ORA’s repair data tells us that, historically, 61% of them don’t get fixed at repair events. Canon has the lowest repair score, with only 36% of its printers getting repaired. Not an endorsement you’ll see stamped on their packaging any time soon.
According to the ORA’s data, if you want to choose a printer brand with the highest chance of a fix when it inevitably develops a fault, then buy one from Brother.
The largest repair shop in existence?
The ORA’s repair data is a perfect example of citizen science. Real people bring real devices to real repairers and each one is meticulously logged for the ORA. Neil’s numbers may surprise you. “Looking at the last 12 months, there’ve been nearly 11,000 items logged per month, which is about 350 repair attempts logged every day,” he said. This is industrial-grade repair at a scale that I doubt many of the top-tier OEMs could match. Yet, this phenomenal repair capacity is just the start.
“That’s from about 1,000 groups. There’s probably about 4,000 to 5,000 repair groups operating regularly worldwide, but they’re not all logging the data.”
Neil admits his figure for the number of groups worldwide is an estimate. However, the growth of the Right to Repair movement, fuelled by the legislative changes they’ve won, is making repair and reuse more accessible. The increase of people seeking a fix, instead of buying new, is indicative of the green shoots of a systemic shift towards a more circular economy.
The ORA knows that there is more repair data out in the real world, either from repair operations that haven’t yet aligned with the ORA or repairers that fix items which are not yet logged.
Either way, Neil is clear on the potential. “We could, definitely with a pinch of salt, be looking at about 50,000 items per month and 1,500 items per day being brought to repair.” If the ORA continues to grow at the current rate, then it won’t be long before it’s the largest repair operation on the planet. In addition, it will be a citizen-led, community focussed and widely accessible endeavour. An exciting prospect.
Which mobile brand is the most repairable?
I’ve simplified the ORA’s segmentation into repaired or unrepaired, but in reality the data is more detailed. Every device is classified as Fixed, End of life, Repairable, or Unknown. Supplemental data describes the nature of a fault or why a repair was, or was not, possible.
This data’s nuances are important for analysis. As an example, here’s the data on the repair rates of the leading players in the mobile market.
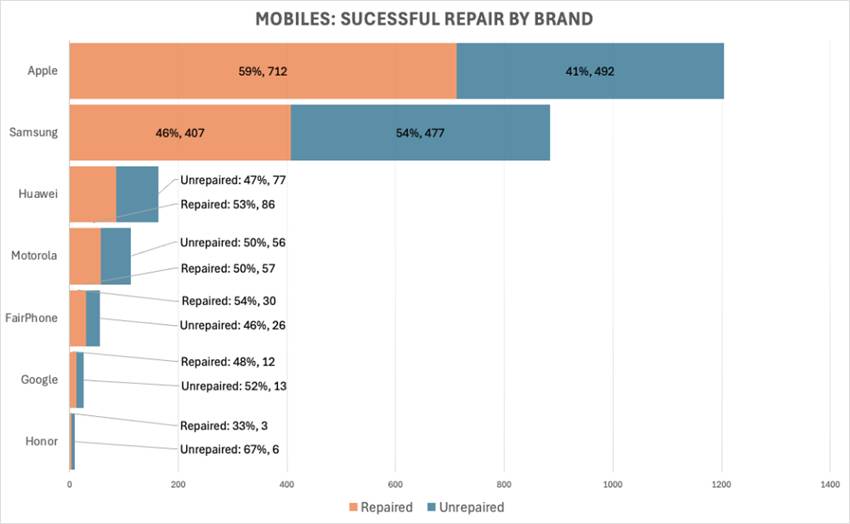
The brand that the ORA’s data logs as most repairable is the famously-hard-to-repair Apple. It easily smashes built-for-repair Fairphone into 5th place.
So, what happened there? Is ORA’s data wrong?
Is the iPhone really more repairable than the Fairphone?
Of course not. The ORA’s data cites that the biggest barrier to a repair is the availability of spare parts and the commercial reality of repair is that there are more spares available for an iPhone than most other brands combined. Although the Fairphone is a million times more repairable than an iPhone, its small sales volume (compared to iPhone) means that there isn’t an abundance of spare part options and most fixers will need to pull something in directly from the manufacturer. At a one-day repair event, this may mean that a Fairphone is graded as Repairable, but not Fixed, as the parts won’t arrive in time.
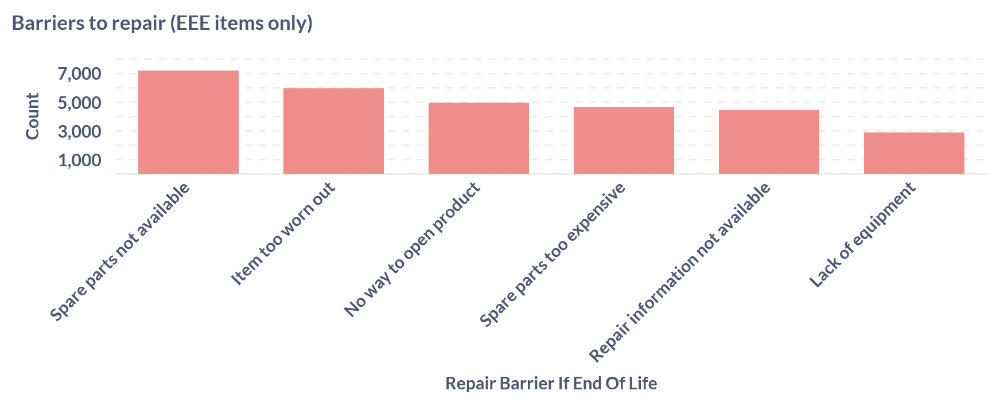
Apple’s market saturation means there are more options for iPhone spares. There’s an increased chance that a repairer may have a dead one for parts harvesting or perhaps has already grabbed some in-demand generic spares from the flourishing third-party parts market. Although Apple parts can be much harder to fit than those of a Fairphone, the ubiquity of the iPhone has forced repairers to develop techniques which enable repair. In short, there is often a better chance of getting an iPhone fixed than one from another manufacturer.
One positive that the data does show is that almost all the brands (with the exception of Honor) have a (roughly) 50% fix rate. That’s an awful lot of handsets saved from premature disposal.
The importance of the Open Repair Alliance’s data
Collating the repair data is a gargantuan task, performed by Monique Szpak, the ORA’s data-wrangler. “I want to give a big shout-out to Monique because she does the majority of the hardcore data wrangling,” said Neil. “She works through, seeing the problems with the data and what needs to be done to clean it up. She does a huge piece of work every year and we couldn’t do it without her.”
Each data line has 14 inputs from a selection of 40 product categories. Harmonising the data input across the thousands of repair groups has been achieved through the creation of the Open Repair Data Standard.
“The first time that we pulled this data together, we had about 29,000 records,” said Neil. Despite implementing the standard, the repairers on the ground may work in non-powered environments. This makes the electronic recording and submission of data during the event an impossibility. Managing data captured in an analogue way is also part of Neil and Monique’s work.
“Sometimes it’s written on the back of a napkin, so the quality can vary,” he explained. “Some of it isn’t yet standardised or classified in any particular way, so it’s quite labour intensive.”
Though the data standard was initially built for recording electronic and powered devices, the ORA is working to expand that remit. “We’re currently thinking the inclusion of unpowered items such as clothing, textiles, bicycles, jewellery,” Neil said.
“Those things are fixed all the time at repair cafés every month and we weren’t collating that data, but we’ve started doing that now, experimentally. It gives a more accurate representation of what is actually happening in repair cafes around the world.”
Circular data: How repair events influence policy
Aside from revealing which brands are more repairable, the ORA’s data also reveals why products break and what prevents them from being repaired. This real-world data is vital to many groups.

“This data gets into policy discussions,” said Neil. “Organisations like the EU’s Joint Research Center are picking it up.” It was also used in the National Interdisciplinary Circular Economy Research (NICER) programme by the UKRI. “We ask people when they download the data to leave a comment as to what their intended use of it is and we’ve had thousands of downloads. It can be academics, repair groups or repair networks but we’ve seen businesses too. We’ve seen some manufacturers download, including Sony Europe and Lenovo.”
The ORA’s data is valuable not only because it reflects the complexities of repair, but it shows an increased desire for people to fix the things they own. Each line is a sortie in the battle against waste and CO2e emissions. The data identifies trends happening globally, with the ability to spot patterns by region, country and community. It also creates a connection from community to policy, providing lobbyists and activists with invaluable data with which to campaign for better right to repair legislation and a more circular and sustainable future.
Hang on, you still haven’t said which laptop is the most repairable?

OK, I promised this.
From the ORA’s data, I’ve isolated the top six laptop manufacturers. Once again, HP has turned up at repair events more than any other brand since 2012. The positive news is that 64% of HP laptops are repaired, nudging Lenovo into second place, leaving Dell, Asus and Acer scrambling for third place on the podium. So if you want a laptop that is repairable, the data suggests HP is the brand to choose.
At the other end of the table is Microsoft. Few Surfaces make it to repair events, but the more worrying statistic is that 78% of Microsoft devices are unrepairable. The next time your CTO mutters about Microsoft Surfaces during refresh meetings, then point them at this chart.
My thanks to Neil Mather from the Open Repair Alliance for his time and generosity. If you’d like to explore the data yourself, it is freely available from the ORA website. If trawling through Neil and Monique’s masterful dataset isn’t your thing, the ORA has published an interactive dashboard, generating fabulous data visualisations which you can slice for yourself. Finally, if you’re involved in a repair event and want to contribute to the ORA’s data collection, then reach out. The more, the merrier.
*2025 data is collated until 31st July 2025.
Related articles
About The Author

Lee Grant
NEXT UP